The analyst function your marketing team doesn't have.
Wildlight Media audits, tests, and builds the measurement layer most ecommerce brands and their media agencies don't have — without taking over your media buying.
Services
Nine ways in*Requires $500k+/month in paid ad spend. †Requires $500k+/month in revenue.
Your media buyers know their channel. Someone needs to know the whole picture.
Independent measurement for ecommerce brands who've stopped trusting platform ROAS — whether you're a lean in-house team, working with an agency, or both.
What this looks like
Extra measurement bandwidth without another full-time hire
A second set of eyes across channels your media buyers each only see one piece of
A real, cross-channel picture for leadership — not five dashboards stitched into a deck
Audits built to produce a next action, not just a diagnosis
Finding the waste to cut and the levers safe to scale
The same rigor applied to your agencies and ad-tech stack as to anything in-house
A few composite scenarios based on patterns I see often — not any single client's numbers:
A Google Ads account had been run by the same in-house buyer for six years — results were steady, so nobody had reason to question it. A fresh audit found match types and bid strategies that hadn't been touched since they were first set up, still running on "it's working" rather than any recent evidence that it was working as well as it could.
A brand's Meta and Google buyers were each hitting their own channel targets, but nobody was checking whether the combined spend was actually incremental — a geo-lift test showed a chunk of a six-figure monthly program was paying for sales that would have happened anyway, freeing budget for a real test elsewhere.
A CMO was getting three different decks from three different platforms, each claiming the win for the same conversions — one reconciled dashboard gave leadership a number they could actually act on.
A two-person in-house team didn't have the bandwidth to properly audit the agency running their paid social — an outside audit caught a stale conversion pixel that had been under-reporting purchases for months.
Tracking passed every internal review but still didn't match Shopify — a rebuilt GA4 event taxonomy closed the gap and gave finance a number it could finally trust.
A brand that had capped its best-performing campaign at the same budget for two years out of caution, where an incrementality read showed it still paying back well past that ceiling — so scaling it funded itself within weeks.
Know your customer LTV?
Use the free tool and find out — cohort payback, not a blended average.
What's My LTV?Services — In Detail
Note: services marked * require at least $500k/month in paid ad spend, and † at least $500k/month in revenue — they depend on enough spend or order volume to test against.
GA4 & Shopify Tracking
GA4 and Shopify are both already collecting your data — that was never the problem. What's missing is the layer on top: a clean, consistent event taxonomy so the numbers are right, plus a reporting setup — GA4's Reports and Explorations, Shopify's own Analytics — so those numbers turn into dashboards you'd actually open. Most setups get the first and skip the second entirely.
See a sample buildReflects Shopify's August 2026 Google & YouTube app update.
Cross-Platform Dashboards
One dashboard instead of five platform tabs that each claim the same conversion. Spend, revenue and contribution reconciled in a single view, with platform-reported numbers shown next to verified ones rather than blended into them. This is Aurelia — the measurement platform behind it.
Explore the live dashboard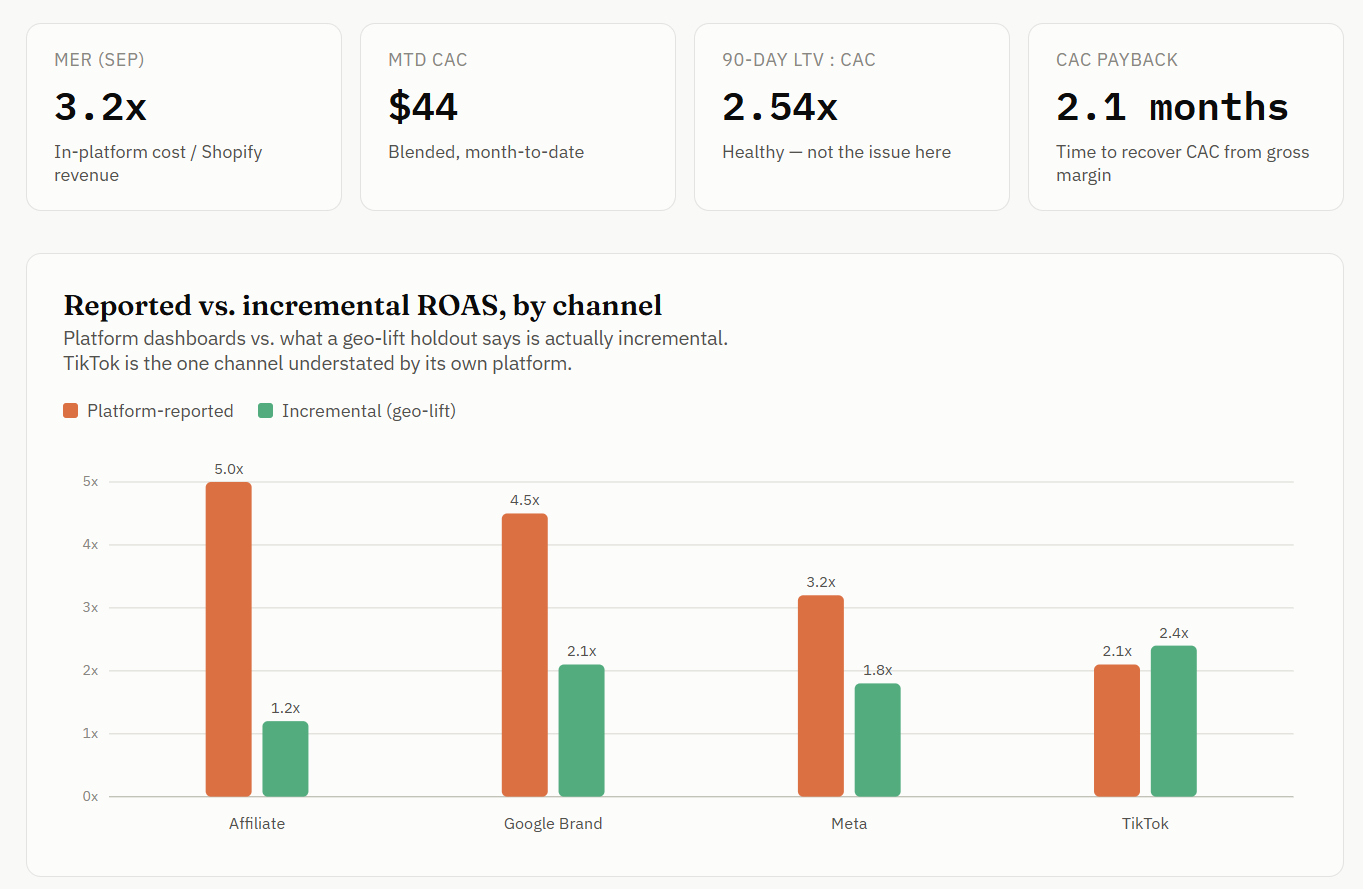
LTV & CAC Analysis
Your real payback period, by cohort and by acquisition channel — not a blended lifetime value averaged across four years of customers who behave nothing alike. It's the number that decides what you can afford to pay for the next one.
Preview the LTV modelMEDIAN $129 · 8,581 CUSTOMERS
Attribution Modeling
A model you own and can inspect, rather than a rented black box that reports whichever answer favors the platform selling you the media. Documented assumptions, your data, and a credit split you can defend in a board meeting.
See how attribution worksPlatform = each channel's own self-reported conversions. Model = a documented multi-touch model built from your session and order data — methodology and assumptions shown on request, not a black box.
Ad Creative Analysis
Which creative is actually driving results, separated from the creative that just collects cheap engagement. Ads tagged by format, hook and offer, then read against efficiency so the next production brief is based on evidence.
See a creative breakdownPredicted at first order from early signals (AOV, product mix, discount depth); validated against realized cohort value as each cohort matures.
Paid Media Audits
A full independent read on what's actually working versus what the platforms report — where spend is double-counted, where the tracking is lying, and what the account would look like if the numbers were trustworthy. Delivered as a written document, not a call.
See a sample auditBidding against another campaign in the same account.
Stat-sig zero conversions, ready to exclude.
→ $14K/mo savedRunning the same ad copy for 6+ months, never tested against anything new.
On brand terms — same 98% impression share at a lower bid.
Missing the custom labels needed to bid up high-margin products in Shopping/PMax.
3 of 5 campaigns can hit a lower target without losing volume. Google never suggests tightening one.
Incrementality Testing Program*
Geo-lift testing on a standing schedule — no pixel, no platform cooperation, no tracking prerequisites. Markets held out, results measured against control, and a running record of what each channel is actually causing rather than correlating with.
See a sample readoutPrice Testing & Optimization†
The same experimental rigor, pointed at price instead of media. Price points and promo depth tested against real demand in controlled markets, with the margin effect measured — rather than elasticity argued about in a meeting.
See a sample price test18 matched DMA pairs · 6-week test · $42 baseline · figures per day
Holdout markets receive no price change; margin change measured against them, not against pre/post company performance.
Budget Planning & Optimization
Turning test results into an actual spend plan — how much goes to each channel next quarter, what gets cut, and what the expected return is at each level. An ongoing engagement that updates as new test results land, not a one-time deliverable.
Scope a budget review— Tom, running Wildlight Media since 2014 — 15 years total running ecommerce media for 7- and 8-figure brands.






How pricing works.
Every engagement is scoped to the account — reach out and you'll get a real number, not a generic rate card. Built on the same AI and automation I use to run the tracking, the testing, and the modeling myself, which is how this is priced like an analyst, not a platform.
 © 2026 Wildlight Media · Tom@wildlightmedia.com · Travelers Rest, SC